New Relic Session Replay
My role
Product design lead
Product design lead
My task
UX / UI design
Competitive research
User reserch and testing
UX / UI design
Competitive research
User reserch and testing
Team
Two product managers,
nine core engineers,
content writer and a support designer
Two product managers,
nine core engineers,
content writer and a support designer
At a glance...
The challenge
When front end developers troubleshoot issues, they need to know both what the user was doing and how the application was responding when the issue occurred so they can gauge severity, reproduce errors, and identify root causes. Previously, New Relic offered only data-centric logs and traces, requiring developers to translate lengthy text into an approximation of what the user was doing.
Design strategy
Multi-contextual alignment
I designed a unified diagnostic experience that synchronizes three distinct contexts into a single, real-time frame of reference:
- Visual (Replay player component):
The exact UI experience and user interactions -
Behavioral (Event trail component):
A narrative of route changes, JavaScript errors, and custom events. -
Technical (Session traces component):
The granular "under-the-hood" logs and network calls.
The impact
- Rapid adoption:
Scaled to 1,000+ active accounts and 7 million weekly sessions within six months of launch.
- Revenue growth:
Generated $3.52M in Monthly Recurring Revenue (MRR), establishing Session Replay as a core pillar of New Relic's Browser capability.
- Improved user experience:
Eliminated context-switching by providing a "single source of truth," allowing developers to move from observing a symptom to diagnosing a root cause in one fluid motion.
1. Discovery & definition
Session Replay is our number one requested feature from current and prospective customers. It provides visual context of what the end user was doing alongside the telemetry data of how the application was behaving. Session Replay also expands New Relic’s capabilities from traditional app monitoring to Digital Experience Monitoring (DEM).
Before I start, I need to understand what customers are expecting from a session replay tool. I conducted a competitive analysis of session replay features, mapping out the functional landscape and identifying opportunities for differentiation.
Before I start, I need to understand what customers are expecting from a session replay tool. I conducted a competitive analysis of session replay features, mapping out the functional landscape and identifying opportunities for differentiation.
Jobs-to-be-Done
I also conducted internal qualitative research with our engineers who use ‘Fullstory’ user session replay on a daily basis. The interviews revealed they prioritize time-to-insight, specifically through the immediate visibility of key events on the replay timeline. And they appreciate the ability to quickly link errors, the user action and data together for incident triaging.
I synthesized these findings into Jobs-to-be-Done statements by distilling user motivations, core goals and critical actions.
- The reproduction: As a front-end engineer, when a JavaScript error occurs, I need to see exactly what the user was doing leading up to it, so I can recreate the issue.
- The impact: As a front-end engineer, I need to see how the application behaved during the error to determine if this was an isolated incident or a critical failure affecting the entire user journey.
- The root cause: As a full-stack engineer, I need to correlate user actions with back-end technical events on a single timeline, so I can pinpoint the source of a bug without switching contexts.
2. Strategic framework
The friction of
context-switching
Why is troubleshooting so difficult?
When developers are troubleshooting an issue, they need to hunt through a sea of fragmented data—logs, traces and timeline—to reconstruct what the user actually did leading up to an error. Translating lines of text into a ‘best guess’ of user behavior creates cognitive load and delays critical time-to-insight.
Design approach
When a developer is deep in a "debugging flow," the biggest productivity killer is context switching—jumping between tabs to match a timestamp in a video to a specific line in a log file. To solve this, I focused on creating a unified view where the replay player, event trail, and session traces all move together in real-time.
This alignment follows the natural way developers troubleshoot: they see a problem in the UI → identify the high-level event → in need of the granular logs to find the root cause. By keeping these three layers side-by-side and in synced, we remove the friction of context-switching, allowing developers to move from observing what happened to understanding why it happened in one fluid motion.
3. Distilling high-volume data
Navigating the noise
Reviewing session replays is traditionally labor-intensive. By overlaying event markers like JavaScript errors and route changes onto the timeline, we provide engineers with clear visual cues.
Here are some explorations around designing a scrubber that doesn't just play back a video, but actively surfaces the critical signals, allowing engineers to jump straight to the root cause.
Designing for
high density data
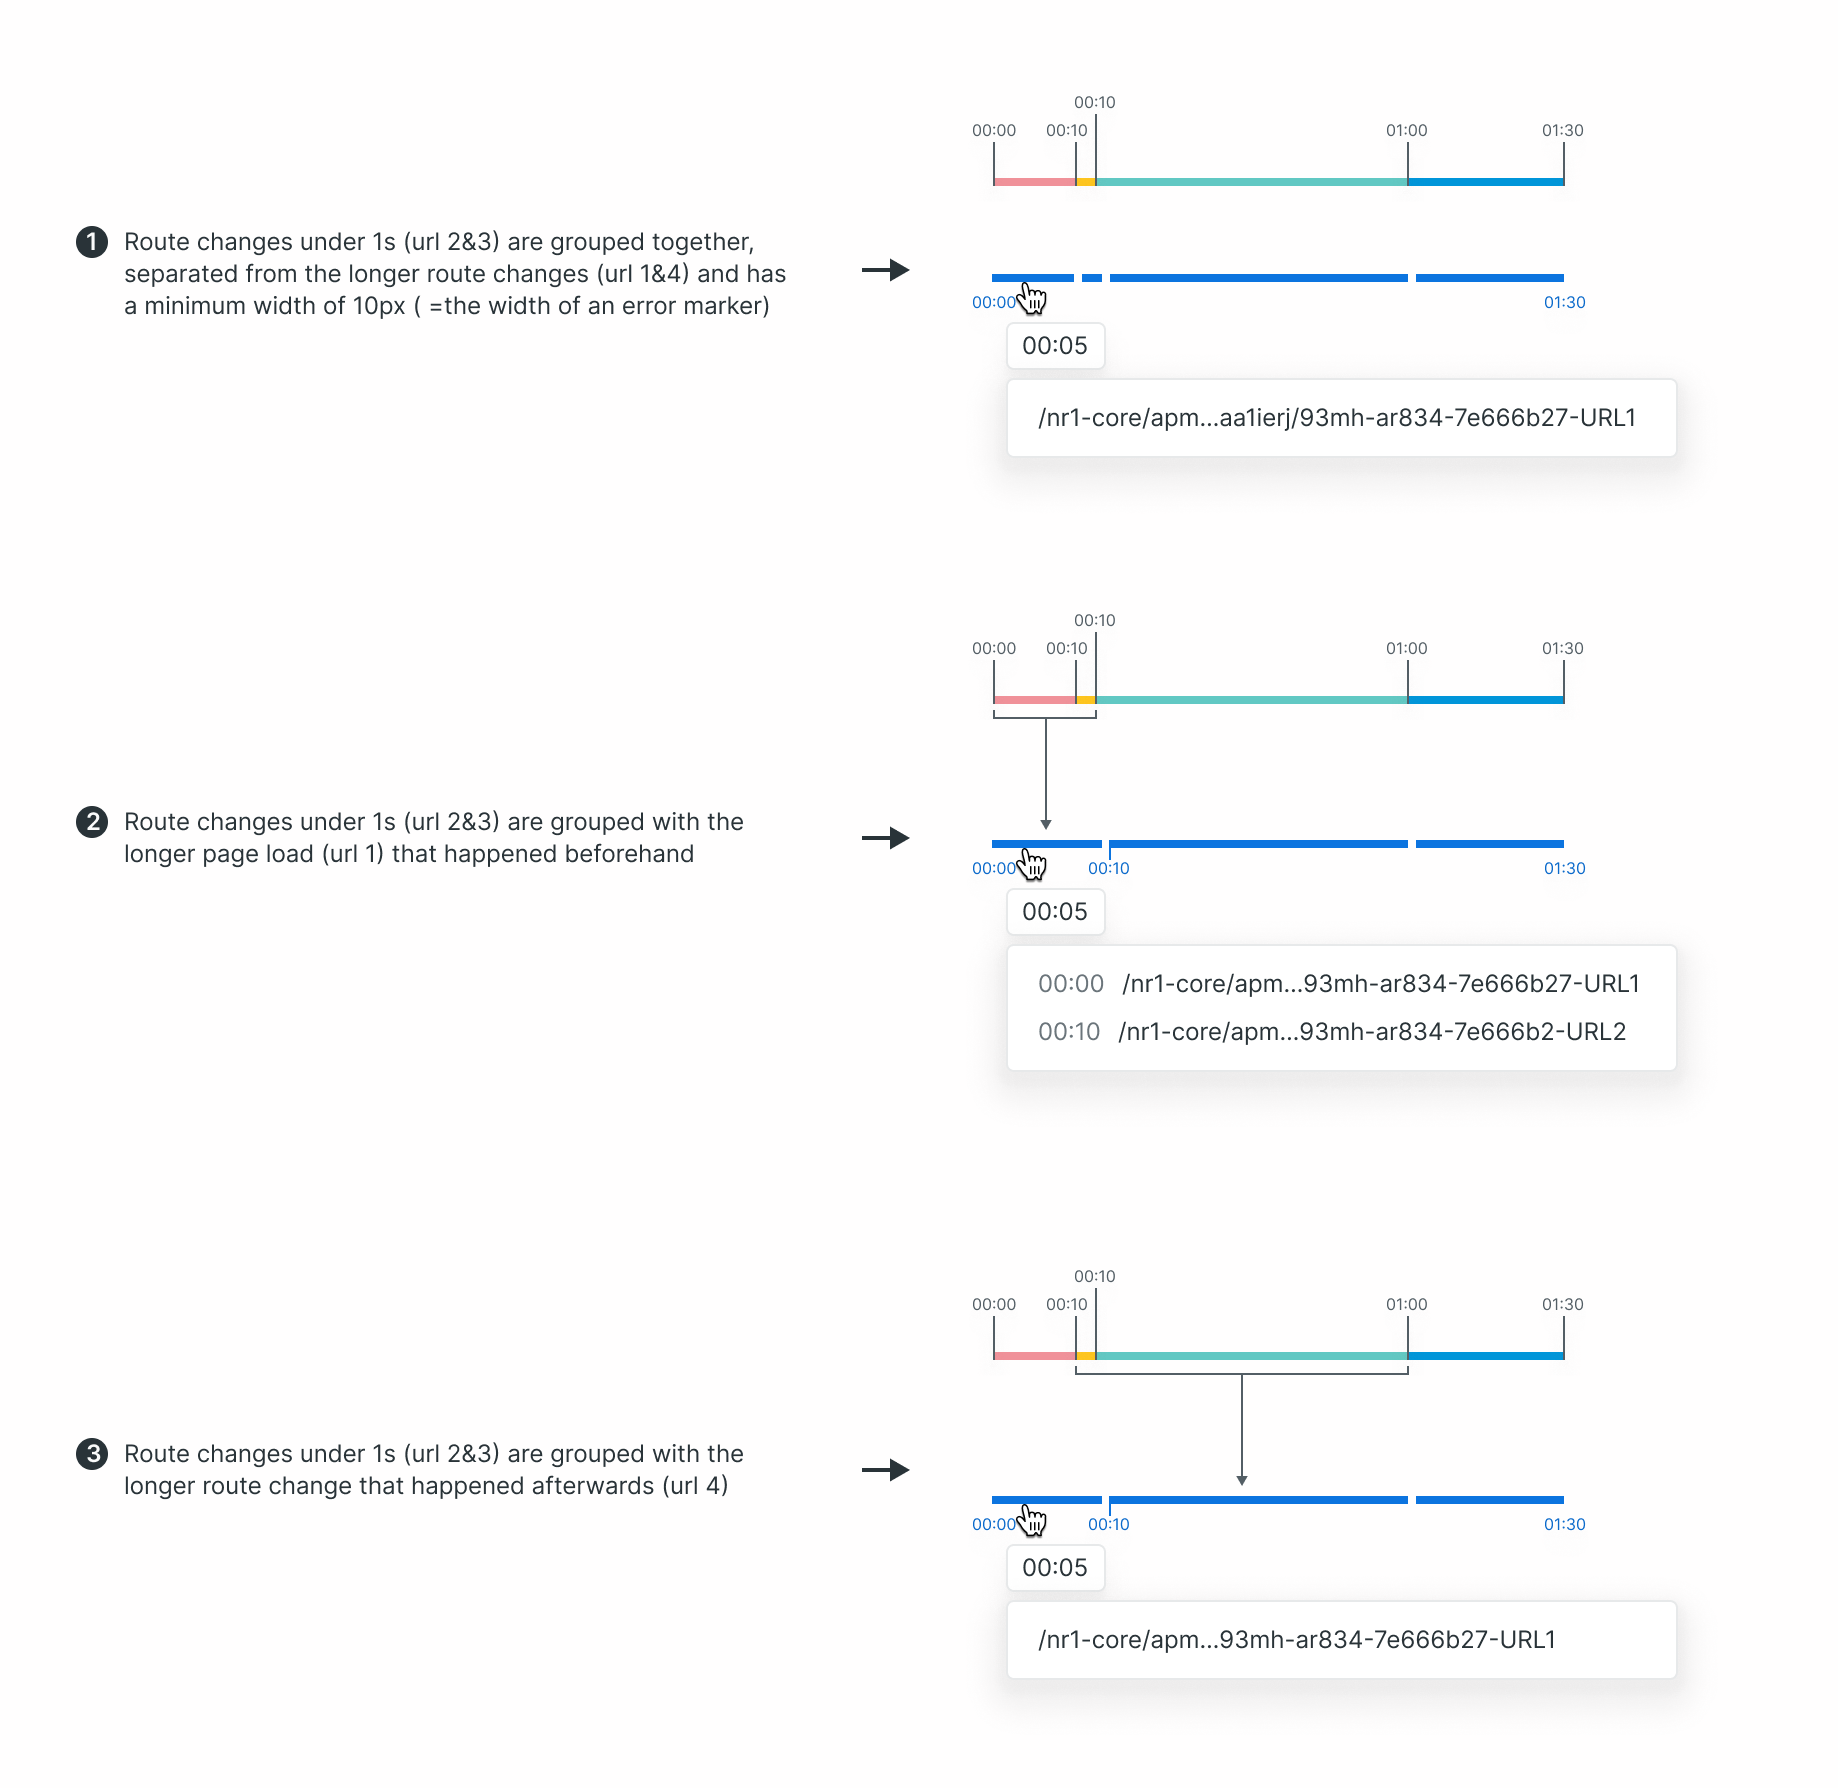
To help users parse long sessions without cognitive fatigue, I developed a "chapter system” that organizes dense route changes into a scannable timeline. By clustering rapid-fire interactions, we reduce visual noise while maintaining a 10px minimum hit-area for accessibility.
This diagram illustrates three logic models for grouping sub-second events—balancing a high-level overview with granular accuracy.
Responsive markers for better legibility
To ensure the timeline and error markers remains useful on any screen size, I designed a merging mechanism for error markers—much like how a map groups landmarks as you zoom out.
This "eagle-eye" view automatically clusters overlapping errors into a single interactive marker, maintaining a clean workspace while preserving the detail within a tooltip.
4. Validation
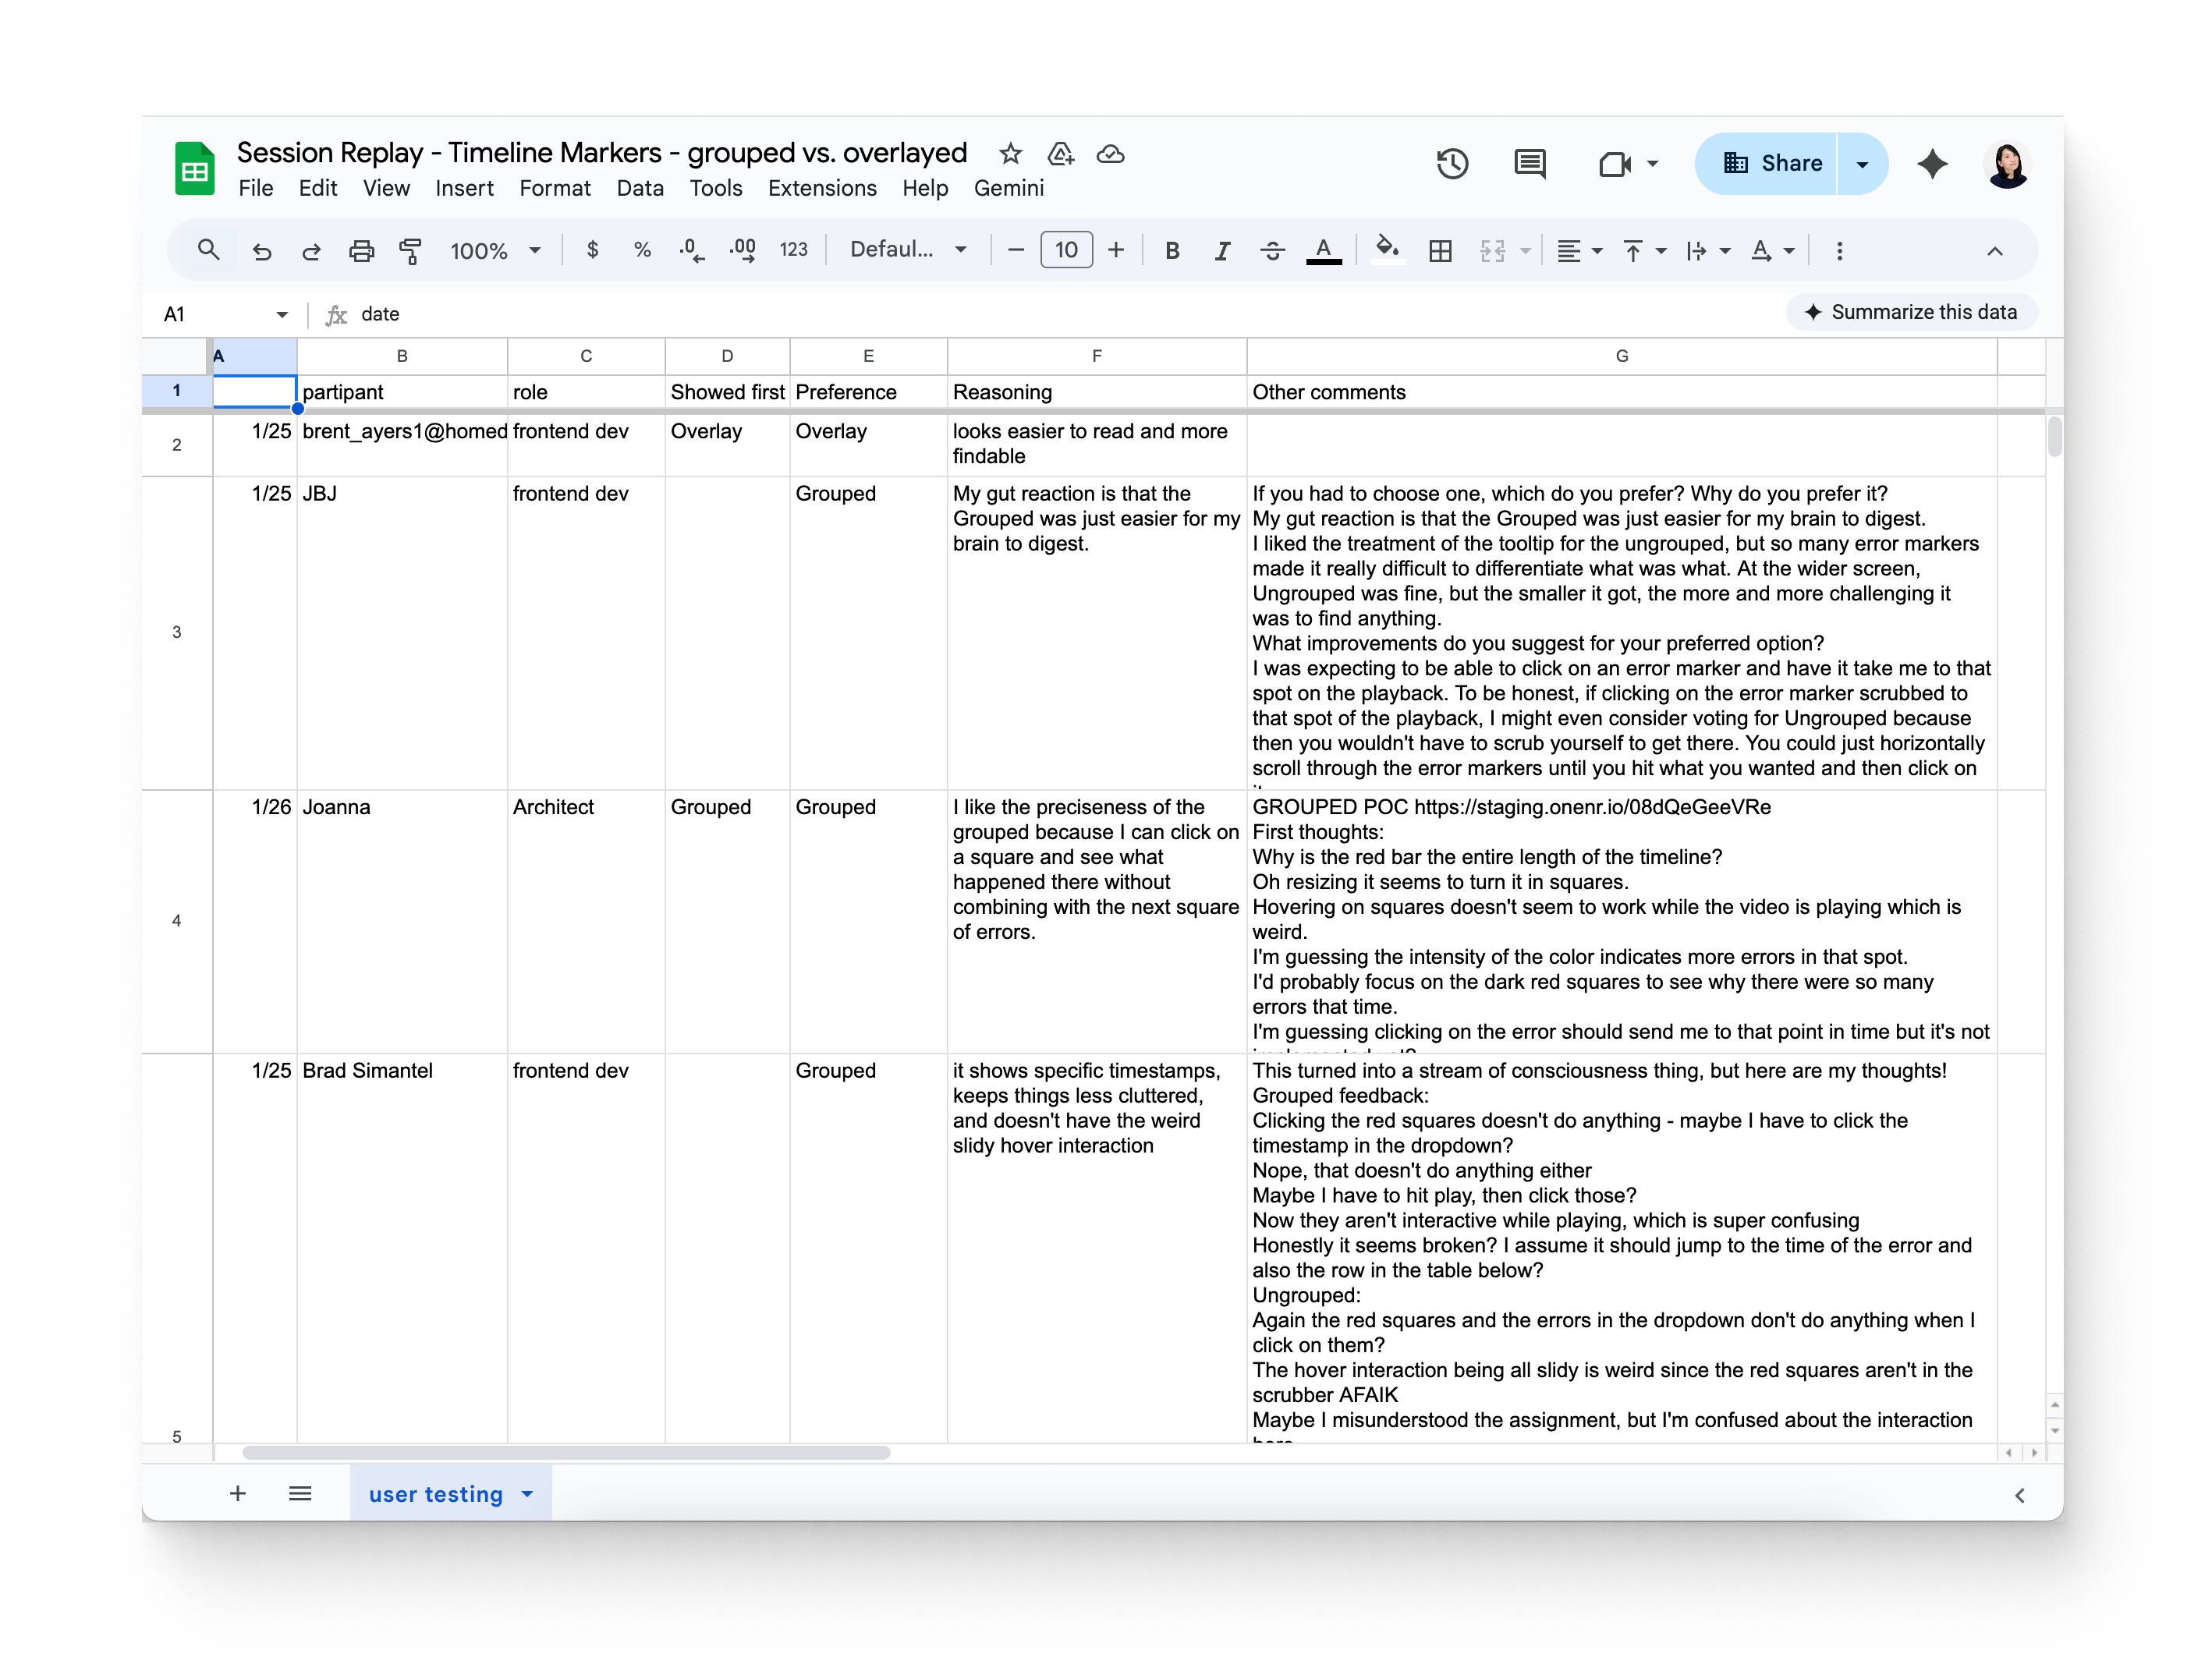
I conducted an internal user test to validate this ‘grouped’ approach against the ‘overlay’ (no-grouping) approach on the session replay timeline. My goal was to determine which pattern best helps users maintain an "eagle-eye" view of session when in small space.
The findings were definitive with the grouped approach:
The findings were definitive with the grouped approach:
- Cognitive ease: the grouped view was "easier for the brain to digest" and "keeps things less cluttered" compared to the overlay approach.
- Precision: participants liked that they could click a single square to see exactly what happened in that timeframe without overlapping with other error sets.
- Efficiency in investigation: The red deepens as more errors cluster together, creating a natural ‘heatmap’ that shows users where the most issues occurred and where to start their investigation.
• • •
Seeing it all come together
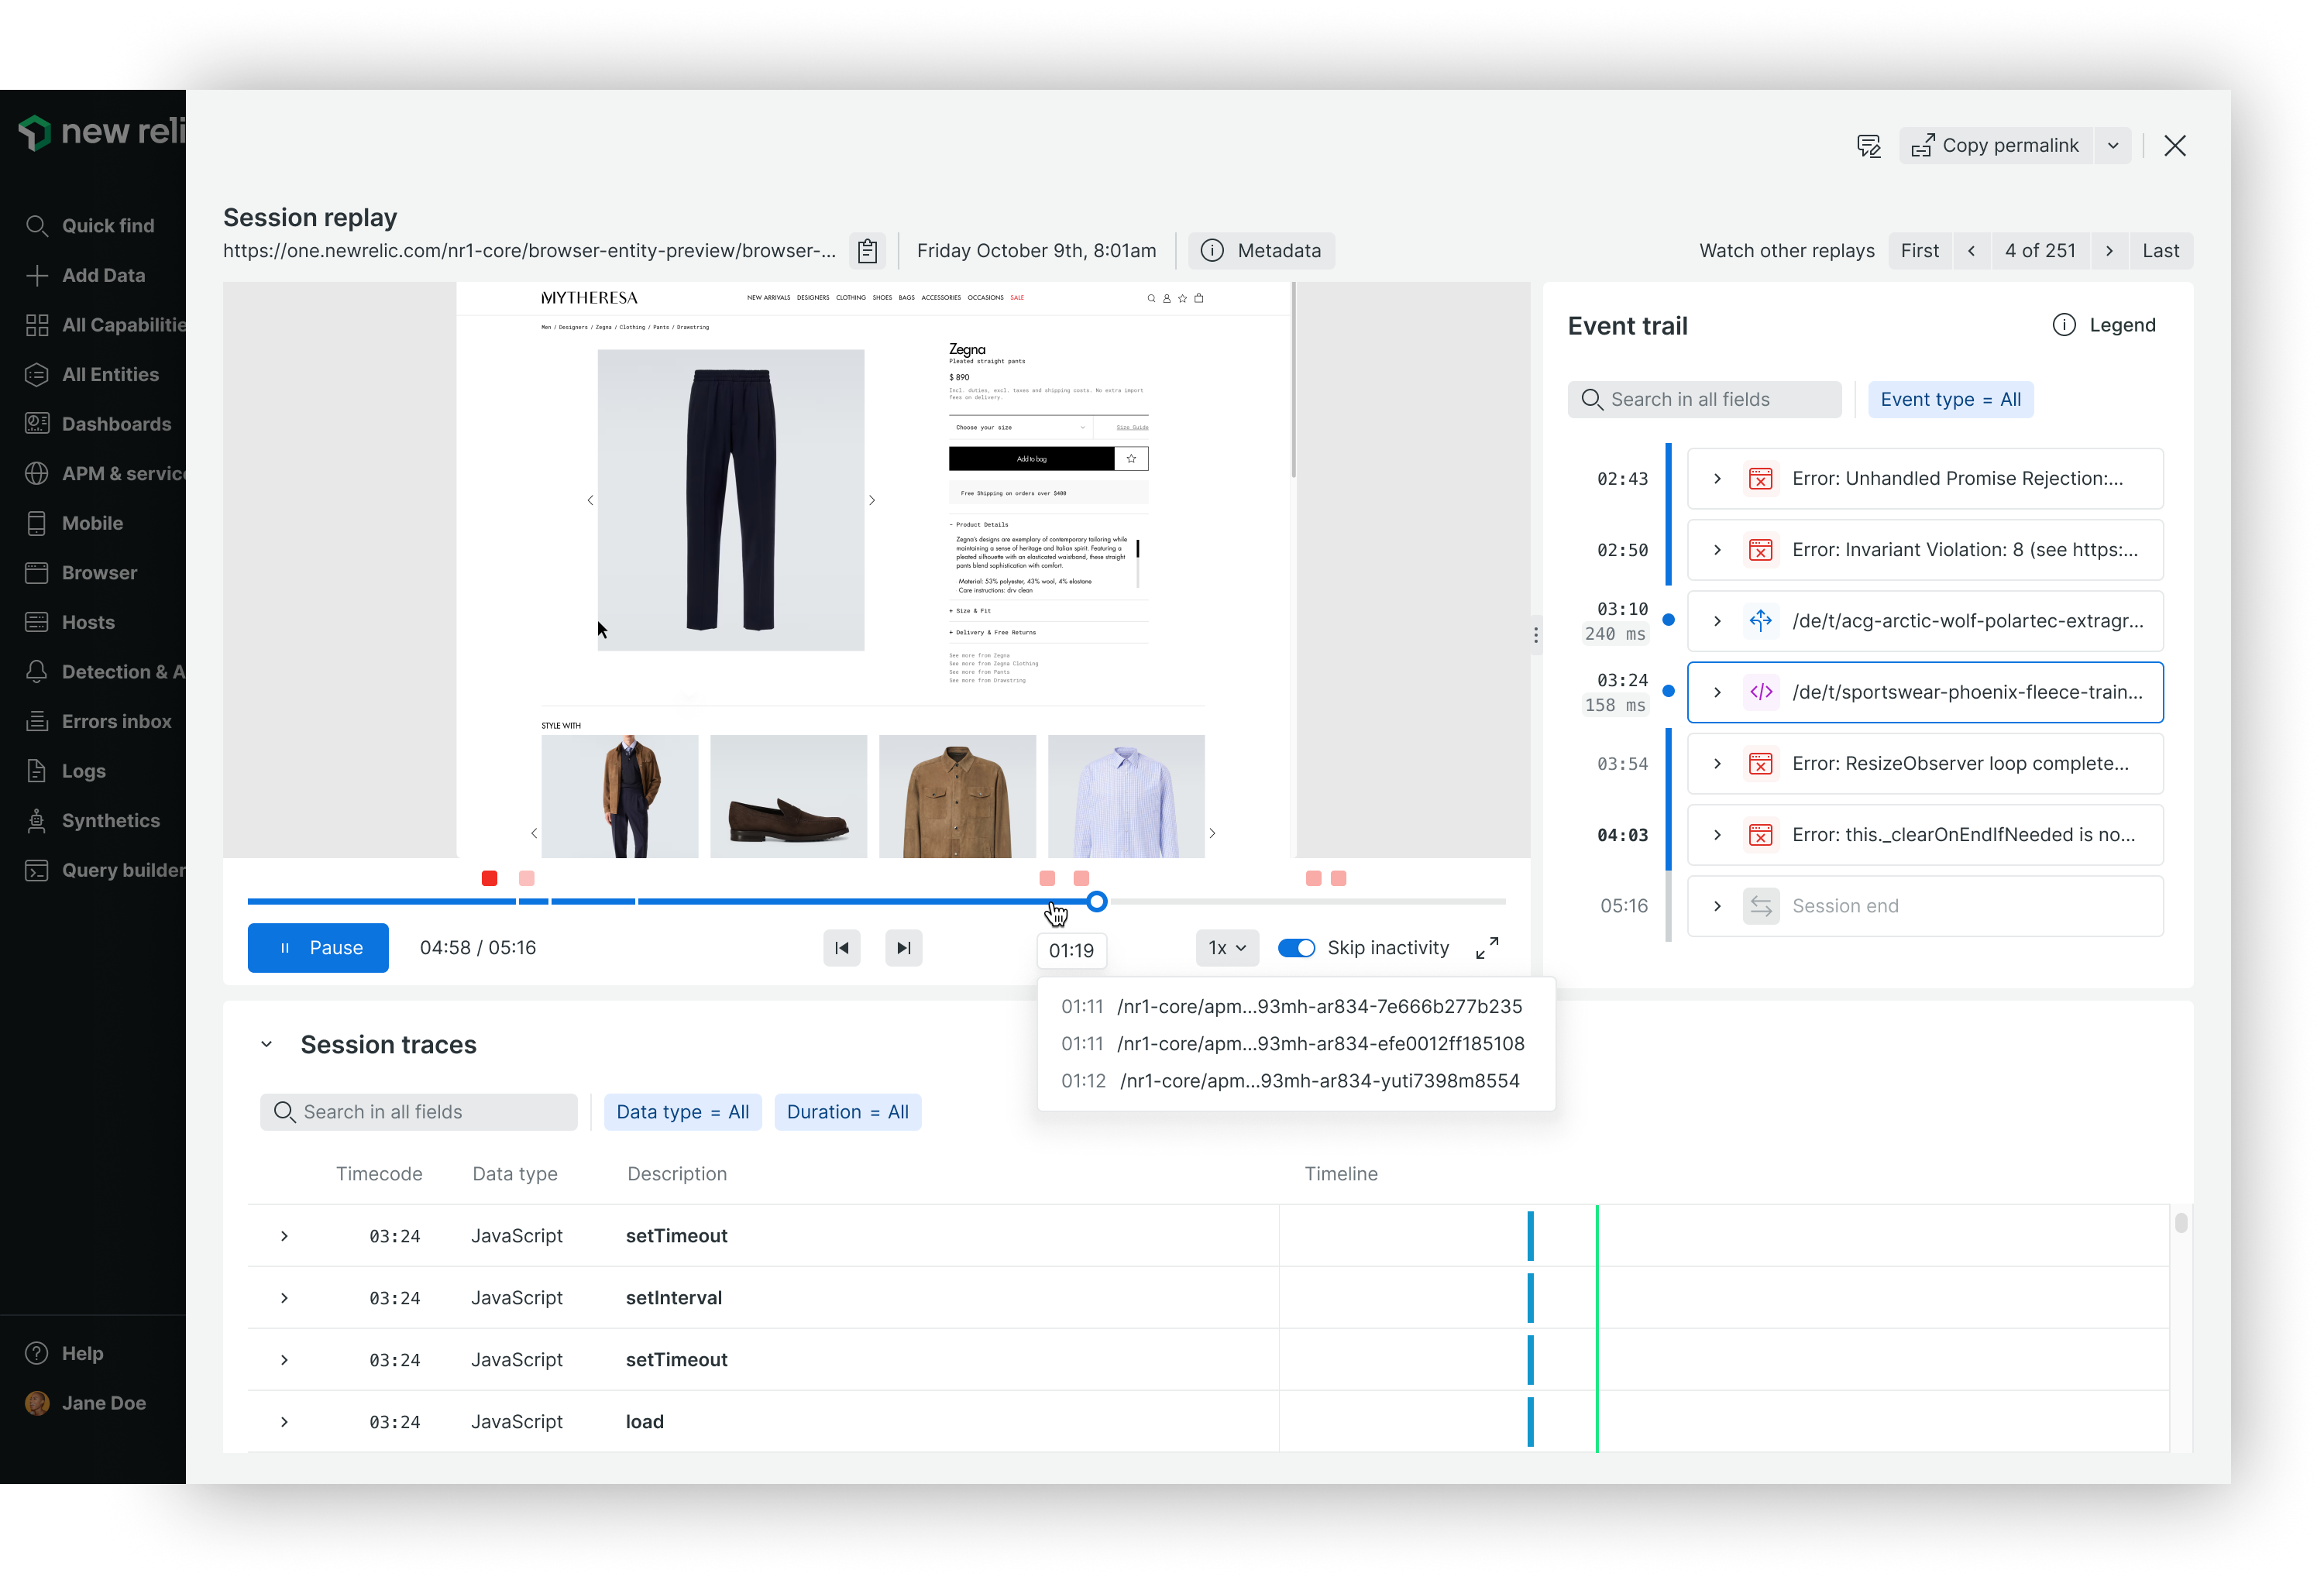
The final design of New Relic Session Replay is not just a "video player" but a synchronized diagnostic tool. By unifying the video player (with timeline scrubber) and the 'Event Trail' and 'Session Trace' components, I ensured that every technical signal is perfectly in sync with the user's visual journey. It allows developers to see an error and the user's behavior side-by-side, at the exact moment it happened. This balance of granular detail and intuitive context is what ultimately cuts the time-to-insight from minutes to seconds.
The final design of New Relic Session Replay is not just a "video player" but a synchronized diagnostic tool. By unifying the video player (with timeline scrubber) and the 'Event Trail' and 'Session Trace' components, I ensured that every technical signal is perfectly in sync with the user's visual journey. It allows developers to see an error and the user's behavior side-by-side, at the exact moment it happened. This balance of granular detail and intuitive context is what ultimately cuts the time-to-insight from minutes to seconds.
5. Business and user impact
- Rapid Adoption: Scaled to 1,000+ active accounts and 7 million weekly sessions within six months of launch.
- Revenue Growth: Generated $3.52M in Monthly Recurring Revenue (MRR), establishing Session Replay as a core pillar of New Relic's Browser capability.
- Operational Efficiency: Eliminated context-switching by providing a "single source of truth," allowing developers to move from observing a symptom to diagnosing a root cause in one fluid motion.
See it in action
